The Critical Path for CFOs Today
How workforce flexibility helps CFOs improve cash flow, capture growth, and reduce costs across manufacturing and warehouse operations.

When you’re in operations, you're always thinking of the future. Whether it’s for the next shift, next week or next quarter, you’ll need to create a forecast that will help you prepare for the demand coming your way. And for all businesses, there is a common practice of how those operations plans are created. You look at historical demand, take the average, and build your forecasts off that.
I’ll give you an example. Let’s say you’re an operations manager, and you have to plan how many units you’re going to ship out of your building for the next year. Using that historical data, you’ll then decide how many full-time employees you’ll need for the year. So what do you do? You take the average demand for the year before, maybe add in some variables like 10% expected YoY growth, add in a couple volume spikes for different sales you’ll run, and there you have it, your demand plan. From there, you take the daily average and figure out how many full time employees you need to fulfill that amount of volume on a daily basis.
Now let’s fast forward, that year you just prepared for is here. It’s time to execute that plan:
Demand comes in 10% over your plan. What do you do? You can bring in more hours which will lead to overtime or just extend out your backlog which will increase your lead time. You decide to put the customer first (good choice) so you go with OT and the volume is knocked out.
Demand comes in 10% below plan. Well darn, didn’t see that coming! So now what do you do? You offer some voluntary time off because you’re overstaffed. But by the end of the day, you only got 5 people that wanted to leave while you needed 10. There goes your cost/unit.
Volume comes in 20% over plan. Here we go again, let’s bring in some overtime!
I think you get my point. When you have a workforce that is constant, matching that to your unpredictable and fluctuating demand is tough. You’ll have to pay overtime when demand comes over plan, and you’ll be overstaffed when demand is under. Simply put, your performance will be average because that’s exactly what you planned for.
So, what’s the solution?
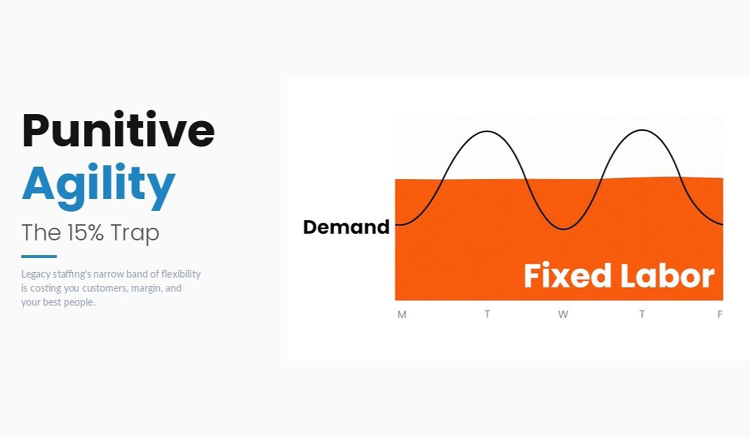
See the graph below: The solid blue line is your fluctuating demand. Instead of building your full-time headcount to your average demand (green dotted line), build your headcount to your minimum volume (yellow dotted line). As demand comes in above that minimum headcount, that’s when you bring in Veryable operators to tackle your demand. When your volume is lower, equaling the yellow dotted line, now you just created the flexibility to scale down.

No more overtime, no more being overstaffed, no more extended lead times! Since you planned for your minimum demand, you now have maximum flexibility. And guess what that means, maximum returns.
Change the way you forecast. Do away with the average, because that’s the only way your performance won’t be average.


Create your free business profile and begin building your on-demand labor pool today.